Real Estate Agent "Year in Review" Page Generator
Create a scroll-based "Year in Review" landing page for a real estate agent following the EXACT design specifications below. Do not deviate from these styles.
MY INFORMATION
Name: [Your Full Name]
Title: [Your Title, e.g., "Luxury Real Estate Specialist"]
Brokerage: [Your Brokerage Name]
Year: [Year, e.g., 2025]
Markets/Cities Served: [List your cities - these will appear on the map]
MY STATS
Metric
My Number
Market Average
Open Houses Hosted
Miles Driven
Cities Served
Total Showings
Properties Toured
Avg Miles Per Week
Total Online Views
Market Avg Views
Views Multiplier (e.g., 3.2×)
Offers Written
Monthly Offer Breakdown (J-D)
Client Acceptance Rate
Avg Offers to Close
Homes Sold
Total Sales Volume
% Sold at List Price
My Avg Price Drop
Market Avg Price Drop
My Avg Days on Market
Market Avg Days on Market
% Faster to Sold
EXACT DESIGN SPECIFICATIONS
Color Palette (Light Mode)
css
--bg-primary: #FAFAF8;
--bg-card: #FFFFFF;
--bg-elevated: #F5F5F2;
--text-primary: #1A1A1A;
--text-secondary: #4A4A4A;
--text-muted: #8A8A8A;
--accent: #9A7B4F; /* Golden brown - primary accent /
--accent-light: #7A5C32;
--accent-glow: rgba(154, 123, 79, 0.12);
--sage: #5A7A62; / Green - for offers/open houses /
--warm: #B86B4A; / Terracotta - for miles/pricing */
--border: rgba(0,0,0,0.08);
Typography
Primary Font: 'Inter' (sans-serif) - body text, labels, captions
Display Font: 'Cormorant Garamond' (serif) - all large numbers and headlines
Hero Numbers: font-weight: 300, line-height: 0.85, letter-spacing: -0.02em
Labels: 10-11px, letter-spacing: 2-3px, uppercase, color: text-muted
Captions: 13-14px, line-height: 1.7, max-width: 380px
Number Sizing Scale
Hero (intro year): clamp(140px, 28vw, 360px)
Large (primary stats): clamp(72px, 12vw, 160px)
Medium (secondary stats): clamp(48px, 8vw, 96px)
Card stats: 32-56px
Spacing & Layout
Slide padding: 80px 60px (desktop), 60px 30px (mobile)
Grid gaps: 60-100px between major elements
Card padding: 24-32px
Card border-radius: 8-12px
Card border: 1px solid var(--border)
Animation Specifications
Easing: cubic-bezier(0.16, 1, 0.3, 1) for all transforms
Slide fade-in: opacity 0→1, translateY(40px→0), duration 1s
Stagger delay: 40-80ms between grid items
Bar chart grow: height 0→target, duration 1s
Line drawing: stroke-dashoffset animation, duration 1.5-2s
Hover transitions: 0.3s ease
Visual Effects
Cursor Glow: 400px radial gradient following mouse, opacity 0.35
Ambient Orbs: 400-700px blurred circles, opacity 0.25, subtle parallax on scroll
Floating Particles: 2px dots with float animation (intro/outro slides only)
EXACT PAGE STRUCTURE
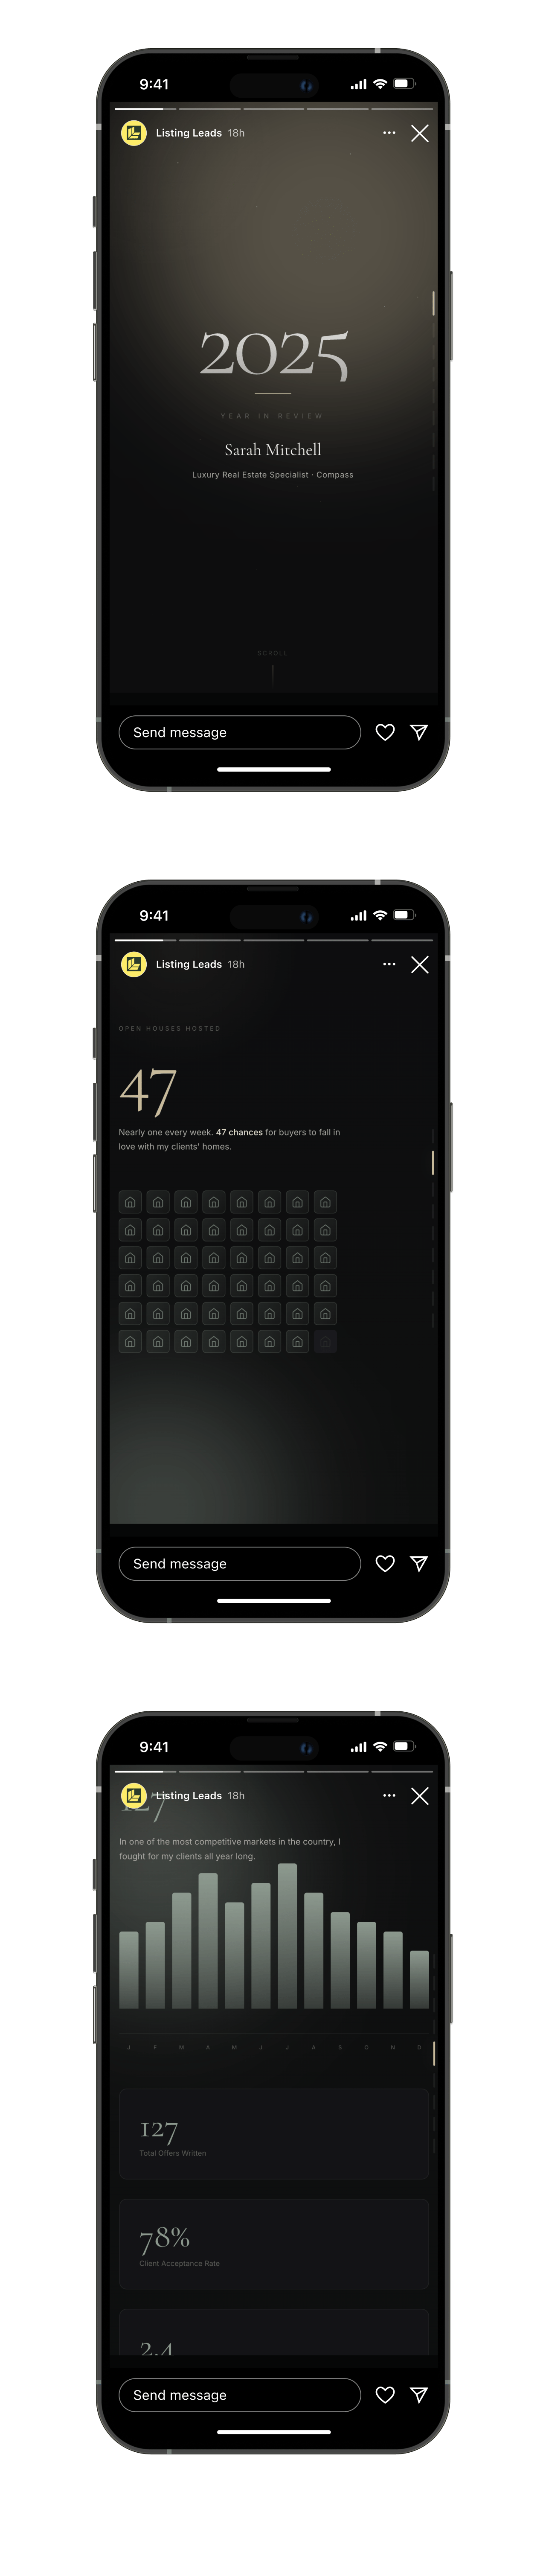
SLIDE 0: INTRO
Centered layout
Year in massive Cormorant Garamond with gradient fill (accent → warm)
1px accent line below year (60px wide)
"Year in Review" label above name
Name in 28-48px Cormorant
Title in 13px secondary color
Scroll indicator at bottom: "SCROLL" text + 40px gradient line, gentle pulse animation
SLIDE 1: OPEN HOUSES
Two-column grid layout
Left: Label → Hero number (accent color) → Caption
Right: 8-column grid of house icons (48 cells for full year)
Filled cells: sage green gradient background, 1px sage border
Empty cells: muted background
SVG house icon in each cell
Cells stagger in on scroll (40ms delay each)
Hover: scale 1.15, box-shadow
SLIDE 2: MILES DRIVEN
Two-column layout
Left: Label → Hero number (warm color) → Caption
Right column contains:
Map container: Card with "Cities Served" label
SVG map with stylized coastline paths (stroke width 40-60px, very subtle)
City dots (4-6px) in warm color with glow filter
Connection lines between cities (animate drawing in)
City name labels (8px)
Bottom-right stat overlay showing city count
Stats grid: 3 columns showing Showings, Avg Miles/Week, Properties Toured
SLIDE 3: ONLINE VIEWS
Centered layout
Label → Hero number (accent) → Caption with multiplier callout
Density comparison: 3-column grid (My Listings | VS | Market Average)
Each side has: Label → Density cloud → Value below
Agent cloud: ~120 dots, clustered toward center, accent color with glow
Market cloud: ~35 dots, scattered wider, muted gray color
Dots animate in with staggered delays (15ms each)
SLIDE 4: OFFERS
Two-column layout
Left: Label → Hero number (sage) → Caption → Bar chart → Month labels
Bar chart: 12 bars (one per month), sage gradient fill
Bars grow from bottom on scroll
Hover shows value above bar
Right: Stack of 3 stat cards (Total Offers, Acceptance Rate, Avg to Close)
SLIDE 5: VOLUME
Three-column layout with divider: Homes Sold | Divider | Dollar Volume
Divider: 200px vertical gradient line
Left: Homes count in massive accent color
Right: Dollar amount in primary text color, smaller
Personal caption below dollar volume
SLIDE 6: PRICING ACCURACY
Label at top
Two-column layout
Left: Fingerprint visualization
Title in italic Cormorant
Two fingerprints side by side (Agent vs Market)
Agent fingerprint: 6 perfectly concentric rings, warm color, center dot with glow
Market fingerprint: 6 irregular/skewed rings, muted color
Caption explaining the metaphor below
Right: Stack of 2 stat cards with comparison
Each card: Main stat (warm) | Divider | Market avg (muted)
Stats: % at list price, avg price drop
SLIDE 7: DAYS ON MARKET
Label at top
Two-column layout
Left: Trajectory chart
Title in italic Cormorant
SVG line chart in card container
Horizontal grid lines (very subtle)
Y-axis labels: List Price, -2%, -4%, -6%
Agent line: Nearly flat/slightly rising, accent color, 3px stroke
Market line: Declining with step-downs, muted color, 2.5px stroke
Reduction markers: Circles on market line where price drops occur
Hover on markers shows tooltip with % drop
X-axis labels: List Date, Week 2, Week 4, Week 6
Legend below chart
Right: Stats stack
Insight box with left accent border
Side-by-side comparison boxes (My days vs Market days)
Delta highlight box (% faster)
SLIDE 8: OUTRO
Centered layout
Headline in Cormorant: "Results like these don't happen by accident." (italic on "accident")
4-5 summary stats in horizontal row (stagger fade in)
CTA button: transparent background, accent border, uppercase text, hover fills accent
Brokerage name at bottom (10px, muted, letter-spacing 4px)
NAVIGATION
Fixed right side, vertically centered
9 small bars (3px × 24px)
Active state: accent color, 40px height, glow shadow
Hover shows section label to the left
Click scrolls to section
RESPONSIVE BEHAVIOR
Below 900px: All two-column layouts become single column
Navigation labels hidden on mobile
Reduce padding to 60px 30px
Fingerprints stack vertically
Stats grids become single column
TECHNICAL REQUIREMENTS
Single HTML file with embedded CSS and JavaScript
Google Fonts: Cormorant Garamond (300, 400, 500, 600, italic) and Inter (300, 400, 500)
Intersection Observer for scroll-triggered animations (threshold: 0.4)
Smooth scroll behavior
No external dependencies except fonts
OUTPUT
Generate a complete, production-ready HTML file matching these exact specifications. Only change the data, name, cities, and brokerage — keep all styling, animations, and structure identical.


.svg)